Performance Summary
This section shows how well the link is predicted to perform in response to the selected combination of the variables, such as band, region, equipment, antenna and height. It shows throughput performance at each end of the link. Throughput values are displayed in either kbps or Mbps depending on the product selected.
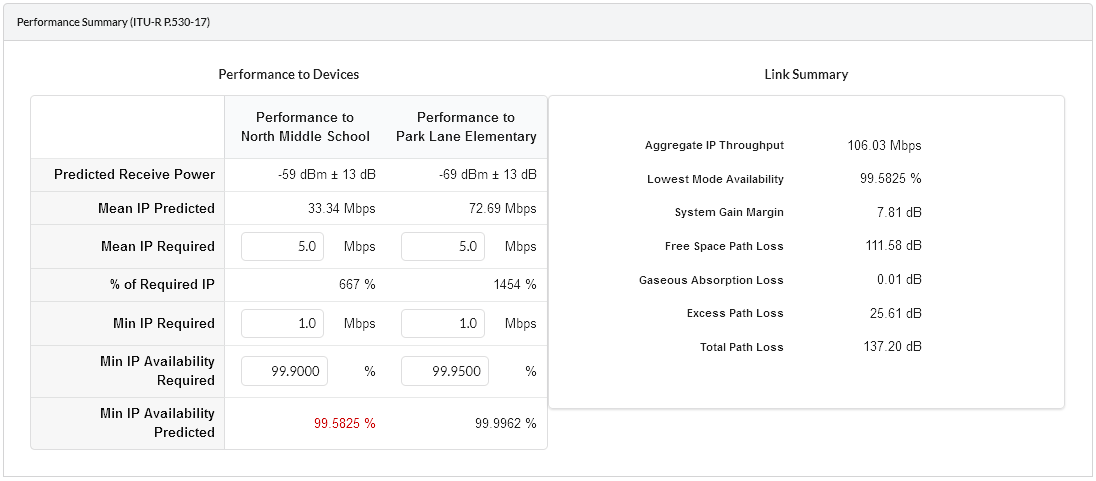
If the predicted Throughput and Availability values fall below the required values, they are displayed in red (Performance Summary). If they meet or exceed the required values, they are displayed in black. In the following example, the predicted values at North Middle School are displayed in red because they fall below requirements, but the predicted values at Park Lane Elementary School are displayed in black because they exceed requirements:
Performance Summary
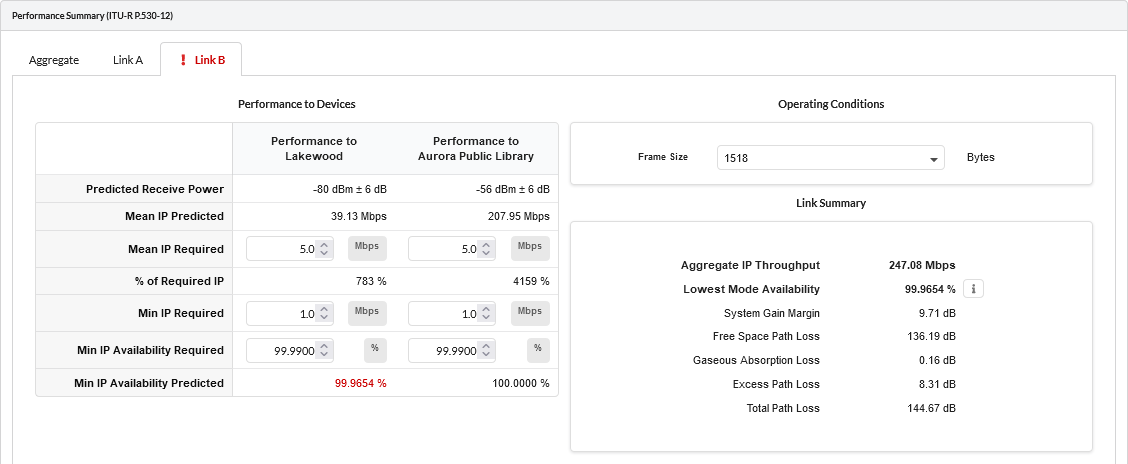
For 2+0 Link Types, the Performance Summary is shown separately for the Aggregate, Link A and Link B paths in tabs. Required Throughput and Availability values can be set individually for each path. The specific path tab is displayed in red, if the individual path (Link A or Link B) or aggregate path fall below the required values. Performance Summary 2+0 Link shows that Link B is not meeting the required values, but the main path (Aggregate) and Link A are meeting the requirements. The link in the list view will be shown in red if any of the three paths are red.
Performance Summary 2+0 Link
Performance to each Site
This summary is a prediction of the Receive Power, Throughput and Availability at each end of the link, based on the equipment and performance data entered. Enter the required values in the data entry fields for comparison with the predicted data.
Predicted Receive Power: The predicted receive power and associated tolerance level at this end of the link. The tolerance is the sum of two components, a fixed value which is dependent on the equipment performance over temperature and a variable value which is proportional to the amount of Excess Path Loss. When using adaptive modulation the receive power shown is the maximum for the link, which corresponds to the lowest selected modulation mode and Maximum Power. If the link is operating in a higher modulation mode, the normal operating receive power of the link may be lower, as many products have transmit power which varies with modulation mode.
Operational Power: For PTP 8xx when ATPC is set to Enabled or for 60 GHz cnWave where APC is always enabled, the Receive Power displayed is the Operational Power. When ATPC/APC is enabled the Maximum Power may be reduced depending on the link conditions, resulting in lower measured receive powers, which can vary over time. The value shown is a typical value at the high end of what may be achieved. The tolerance levels shown are the same as given for the Predicted Receive Power.
Mean throughput of the planned link in one direction:
Mean IP Predicted: The mean Ethernet throughput capability, calculated from the data entered.
Mean IP Required: Enter the required mean Ethernet throughput capability.
% of Required IP: IP Predicted expressed as a percentage of IP Required.
Minimum throughput of the planned link in one direction:
Min IP Required: Enter the required minimum Ethernet throughput capability.
Min IP Availability Required (%): Enter the required minimum availability of the link.
Min IP Availability Predicted (%): The minimum availability of the link, calculated from the data entered, for the lowest equipment data rate.
The Min IP Availability Predicted (%) may be higher than the Lowest Mode Availability if the Min IP Availability Required is set to a value greater than the data rate supported by the Minimum Mod Mode.
If ePMP ePTP Mode is selected the capacity achieved in each direction of the link is variable, depending on the load presented. Which direction of the link will take the maximum load is unknown therefore the values presented in the Performance to Each Site are those of the symmetrical case. Values for the peak throughput in a either direction can be found in Performance Details.
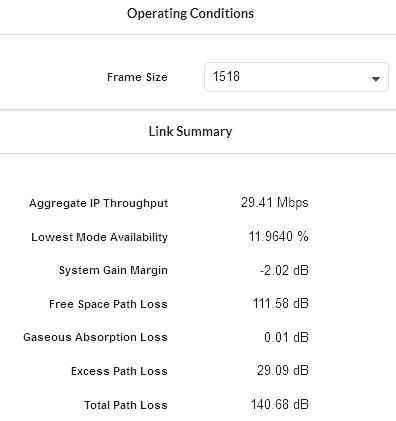
Operating Conditions
This option is only available when the ePMP, PTP550, PTP 820 or PTP 850 products are selected. The throughput of these products is more dependent upon frame size than the other PTP products and this option allows the user to select different frame sizes and view the impact on the throughput.
Operating Conditions for ePMP, PTP 550, PTP 820 or PTP 850
The throughput displayed in the Performance Summary, as well as in the Performance Details, is for the frame size selected. The frame size options are the standard RFC2544 sizes of 64, 128, 256, 512, 1024 and 1518 bytes. There is also an option to select a pre-determined mixed traffic option called Tolly Mix, which is based on the following combination of packet sizes:
55% of packets at 64 bytes
5% of packets at 78 bytes
17% of packets at 576 bytes
23% of packets at 1518 bytes

Tolly Mix is not available for the PTP 850E in the 80 GHz band.
Link Summary
This summary highlights the Free Space Path Loss component and the Excess Path Loss based upon the diffraction loss over the obstacles that cut the Fresnel zone number 0.6. The Total Path Loss and System Gain Margin are also given.
Aggregate Throughput: The sum of the Mean IP Predicted at both ends.
Lowest Mode Availability (%): This is the availability of basic link operation. This is equivalent to the availability of the most robust modulation or better in both link directions.
FCC 99.95%: This is only shown when using PTP 820 or PTP 850 in either of the FCC regulations and adaptive modulation. It shows the modulation mode for the minimum payload capacity required by the FCC and the two-way availability at that mode. In order to meet FCC Part 101 regulations the link must be planned to have an availability better than 99.95% at the minimum payload when operating in adaptive mode.
System Gain Margin (dB): This is the margin in dB above which the ratio of (mean wanted receive level) to (mean interference plus thermal noise), or “C to (I + N)”, for the worst link direction is above the level required for basic link operation for the most robust modulation.
Free Space Path Loss (dB): The amount that the signal would be attenuated if travelling through a vacuum.
Gaseous Absorption Loss (dB): The amount of attenuation due to oxygen and water in the atmosphere.
Excess Path Loss (dB): The amount of attenuation due to obstructions in the path. If the path is completely line-of-sight, this will be zero.
Total Path Loss (dB): The sum of Free Space, Gaseous Absorption and Excess Path Loss.
Performance Summary when TDM is selected
If the equipment is PTP 820G then additional fields appear in the Performance Summary section (Performance Summary with TDM for PTP 820G):
E1 Carried
TDM Availability Required
TDM Availability Predicted
These fields only appear if there are E1/T1 added to the individual path.
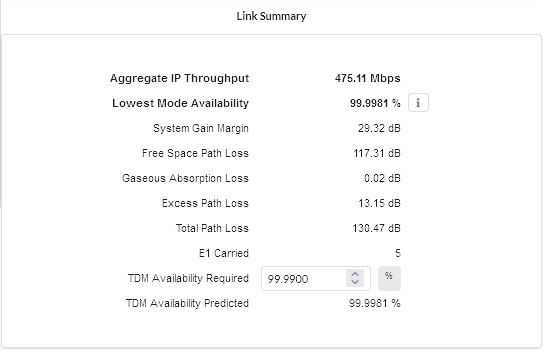
Performance Summary with TDM for PTP 820G
If the Regulation selected is either FCC or Canada (or T1 TDM Type has been selected), then E1 will be replaced by T1. The Availability Required is used in the same way as the Min IP Availability Required. The Availability Predicted is the two way availability of the link.
When operating with a fixed modulation mode the Availability Predicted for the TDM circuits will be the same as the Link Availability.
Link Summary additional information for 60 GHz cnWave, PTP 820 or PTP 850
If the equipment is 60 GHz cnWave, PTP 820 or PTP 850, additional information is available via the ![]() icon. Select the icon to view a new window showing the detailed breakdown of the availability calculations, see Detailed Availability Information (ITU Model). This allows the information to be viewed during planning without having to produce a proposal report.
icon. Select the icon to view a new window showing the detailed breakdown of the availability calculations, see Detailed Availability Information (ITU Model). This allows the information to be viewed during planning without having to produce a proposal report.
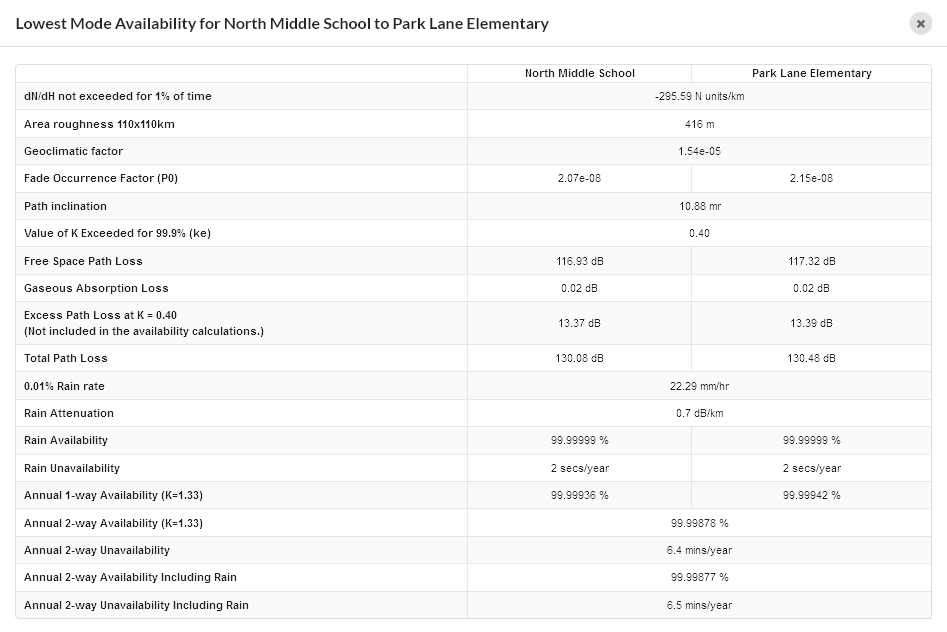
Detailed Availability Information (ITU Model)
This window shows detailed information for Link Availability when in fixed modulation mode or for Lowest Mode Availability when Adaptive Modulation has been selected. When the ITU prediction model has been selected, see Availability, the parameters are as displayed in Detailed Availability Information (ITU Model) and described below:
dN/dH not exceeded for 1% of time: Point refractivity gradient in the lowest 65m of the atmosphere not exceeded for 1% of an average year. This data is provided in 1.5 deg grid form by the ITU and the value is a bilinear interpolation for the mid point of the path.
Area roughness 110 x 110 km: the standard deviation of terrain heights (m) within a 110 x 110 km area. If using the ITU-R P.530-17 model this data is provided in 0.5 x 0.5 degree grid form by the ITU and the value is a bilinear interpolation for the mid point of the path.
Geoclimatic Factor: Calculated from the point refractivity gradient and area roughness according to the selected ITU-R P530 model.
Fade Occurrence Factor (P0): The intercept of the deep-fading distribution with the percentage of time-axis for multipath fading. This parameter is dependent on the Geoclimatic Factor, path length, path inclination, frequency and altitude of lower antenna, calculated as given in the selected ITU-R P530 model.
Path Inclination: Absolute difference in antenna height above mean sea level (m) divided by path length (km), given in mrad.
Value of K Exceeded for 99.9% (ke): This value is taken from ITU-R P.530 Figure 2, the value of ke exceeded for approximately 99.9% of the worst month in a continental temperature climate and is often referred to as “Worst Earth Curvature”. The impact of this value on the terrain height is shown by the grey line on the path profile (Profile with Clutter and Obstructions).
Excess Path Loss at K = ke: This value shows the amount of excess loss that will occur on the link during the time when the K value drops to that shown above. This may occur for up to 0.1% of the time, but is not taken into account in the availability calculations. Links which require at least 99.9% availability should ensure that this value is 0 dB, by selecting appropriate antenna heights to give sufficient clearance.
0.01% Rain rate: Calculated using ITU-R P837, which uses a matrix of rain values for the globe with a 1.25 degree resolution. These values are bi-linearly interpolated for the Latitude and Longitude of the center of the path.
Rain Availability: The availability of the given rain rate with the system gain margin calculated using the selected ITU-R P530 model. 60 GHz cnWave uses vertical polarization.
Rain Unavailability: The amount of time the link is predicted to be unavailable due to rain.
Annual 1-way Availability: The annual availability due to clear air multipath effects in a single direction, shown for each end of the link. This also accounts for any obstructions on the path.
Annual 2-way Availability: The sum of both 1-way unavailabilities, expressed as availability.
Annual 2-way Unavailability: The amount of time the link is predicted to be unavailable due to multipath effects.
Annual 2-way Availability Including Rain: The sum of the Rain Unavailability and the Annual 2-way Unavailability, expressed as availability.
Annual 2-way Unavailability Including Rain: The total time the link is predicted to be unavailable.
When using the Vigants - Barnett prediction model the first five parameters are replaced by the following terms, for further information on the Vigants - Barnett model see Availability :
Terrain Roughness: Standard deviation of terrain height along the path profile, excluding the ends of the path.
Climatic Factor: Derived from the atmospheric conditions maps for the mid point of the path.
C Factor: Calculated from the Terrain Roughness and the Climatic Factor.
Temperature: The temperature is taken from the ESATEMP data. This data is provided in 1.5 deg grid form by the ITU and the value is a bilinear interpolation for the mid point of the path.