Profile
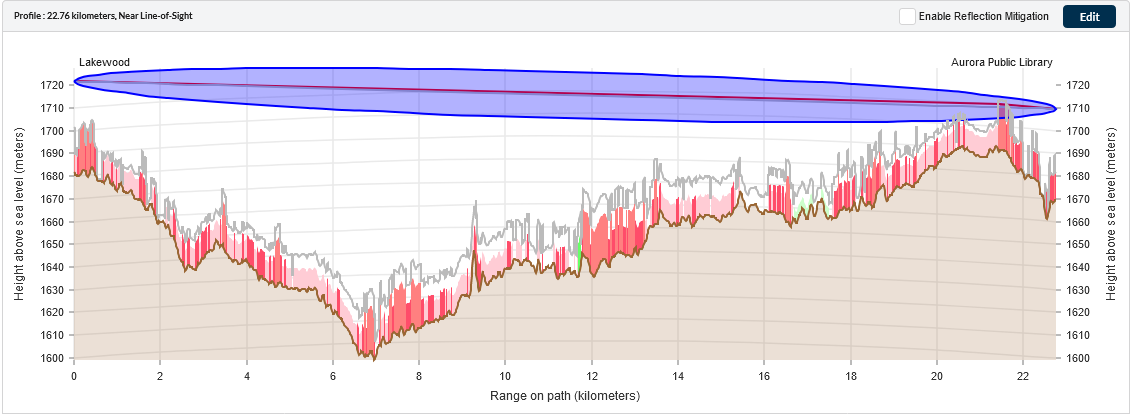
This section contains a visualization of the path between the two sites (Profile with Clutter and Obstructions).
In this example, there are 20m high obstructions above the suburban clutter from 19.569 km and 10.769 km, but the biggest obstruction is provided by the urban buildings around 21.5 km.
Profile with Clutter and Obstructions
Color code used in the profile:
Brown: terrain.
Colored blocks: clutter, see Project Settings for default colors per clutter type
Yellow: obstructions (such as trees or buildings), these can either be above ground level or above the clutter height.
Red: line of site from the antennas to the largest obstruction (called “slope”).
Blue: the Fresnel zone.
Grey: the profile worst case which occurs up to 0.1% of the time. Sometimes known as Worst Earth curvature (Ke).
Antenna azimuth and tilt for each side of the link are shown above the profile. Tilt is displayed in red when the link is obstructed.
To update the profile to allow for terrain height, obstructions and water reflections, see Adjusting Link Profiles.
The Fresnel zone shown is a visualization of 0.6F1, which is shown for guidance when setting antenna heights for path clearance (When clutter is not enabled a visualization of F0.6 or 0.78F1 is shown). It is not used directly in the diffraction loss calculations.
When planning high availability links (better than 99.9%) the antenna heights should be set to ensure that the grey line does not penetrate into the Fresnel zone shown.