Verifying a High Point Using a Map
This is an example to show how Cambium link planners use a map and Google Earth(TM) to estimate the height of the terrain and obstructions near one high point of a test link. We use the following aids:
Path Profiler data imported into LINKPlanner.
LINKPlanner, open at the Link Profile and Profile Editor.
An accurate topographic map with contours at 10m intervals.
The Google Earth aerial photograph zoomed in on the high point.
We follow these steps:
Path Profiler returned the following profile for the high point at range 1.042 km:
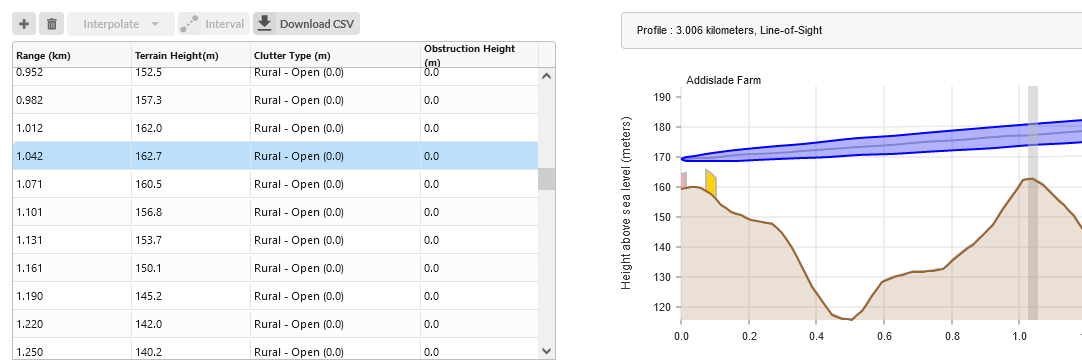
Unadjusted profile near high point
We examine the map of the high point. This reveals that the link path is between the 150 m and 160 m contours:
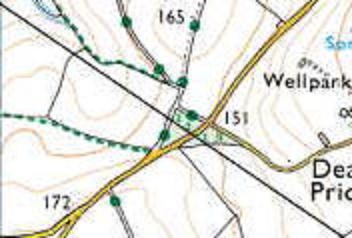
Map of Hp1
The path profile height 162.7 m at range 1.042 km is probably a little higher than the ground height.However, the map also shows a clump of trees surrounding the high point - a potential obstruction. This means that the SRTM height data has incorporated some of the height of the trees but not all of it. We estimate the height of the trees to be 25 m of which 5 m has already been accounted for in the SRTM data.
This is quite a wide band of trees of about 100m and therefore we can modify the clutter type from Rural to Evergreen Forest, which has a height of 20 m in the Profile Editor for the high point and the pixel either side :
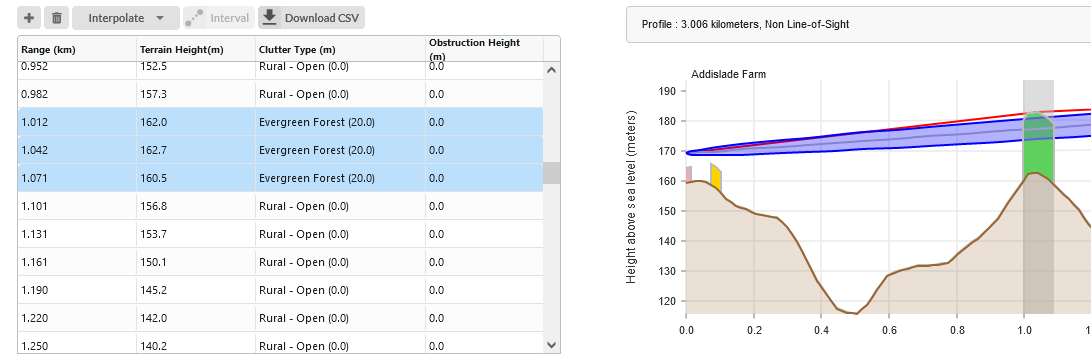
Estimated obstruction height near Hp1
Our conclusion is that the Fresnel zone may be severely obstructed at this high point. This must be confirmed by conducting a high point survey, as described in Verifying a High Point Using a Survey.